100% Facts & Figure
10 Vital Services Data Dashboard
Introduction
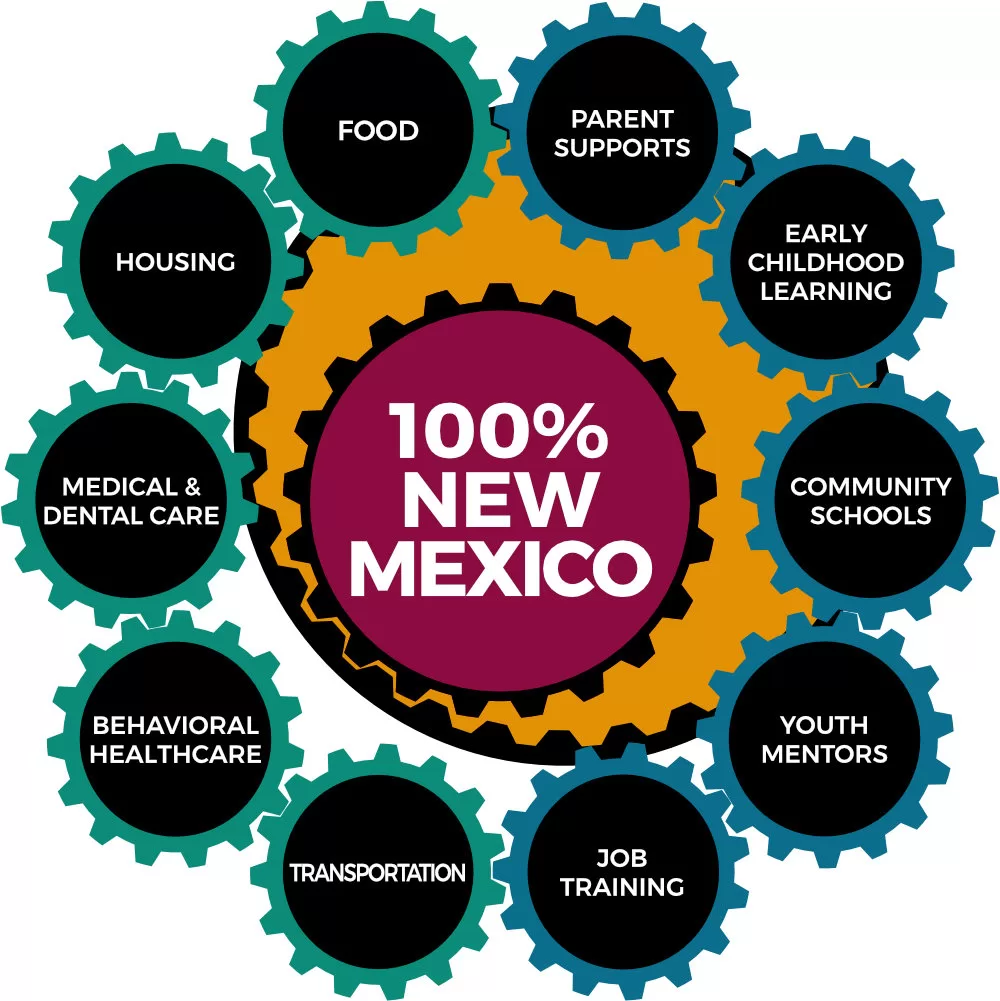
The 100% New Mexico Initiative has launched in 17 counties to strengthen 10 vital service sectors, each essential for community well-being. The map displays the counties currently participating in the 100% New Mexico Initiative (in yellow).
The data dashboards present county-specific data for the ten vital service sectors necessary for surviving and thriving based on the 100% New Mexico Initiative. The data dashboard was developed by Dr. Amanda Griffin at Chapin Hall (agriffin@chapinhall.org). The 10 Vital Services for Surviving and Thriving framework was developed and funded by the Anna, Age Eight Institute and made possible by the New Mexico State Legislature. For questions about the dashboard, please contact the 100% New Mexico Evaluation team at Chapin Hall, 100percent@chapinhall.org.
Counties collect data on community members’ need for, and access to, the ten service sectors and design solutions to address service barriers.
The data dashboard presents data from two complementary sources:
- 100% Community Survey, which offers community-reported experiences and perceived needs and barriers in 100% New Mexico counties.1
- New Mexico County Health Rankings, which is publicly available health and demographic data—including physical and mental health indicators such as substance use, health care access, provider availability, and system capacity—from surveys and administrative sources to provide county-level estimates of health outcomes and community conditions across the state.2
For each graph we note the corresponding dataset where the information is coming from. Using both datasets allows us to view county health and wellbeing through the lenses of system-capacity and community lived-experience perspectives. The goal is to illustrate the availability of services and the lived experience of trying to access those services. You can interact with each graph by clicking the legends and bars to explore the data in more detail.
1. NOTE: 100% Community data are from a resident survey completed by 11,305 county residents between 2019–2024. Data reflect individuals who completed the survey.
2. Data are presented from the 2024 and 2025 New Mexico County Health Rankings data and resources, County Health Rankings & Roadmaps, accessed via the New Mexico Data and Resources page: https://www.countyhealthrankings.org/health-data/new-mexico/data-and-resources
Community Health Data Dashboard
This section presents an introduction to community health and well-being by showing the following indicators across the state by county:
- Physical health (19% statewide): Captures the proportion of adults who rate their physical health as poor or fair.
- Access to exercise opportunities (76% statewide): Indicates the percentage of residents who live near locations that support physical activity, such as parks or recreational facilities.
- Lack of health insurance coverage (11% statewide): Captures the percentage of adults without health insurance, which can limit access to preventive and routine healthcare services.
- Use of the flu vaccine (40% statewide): Reflects the percentage of adults who received a flu vaccination, serving as a marker of preventive healthcare utilization.
The chart illustrates how these indicators vary across counties. Statewide averages can be compared with individual county values by de-selecting counties in the legend at the top of the chart, which allows the numeric value for each bar to appear. For example, Santa Fe County reports 16% of residents self-reporting poor or fair physical health, compared with the statewide average of 19%.
Additionally, by displaying counties side by side, these visuals make it easier to compare broad patterns and identify areas where access to health services and community conditions vary across the state.
The figure below summarizes alcohol use, smoking, and drug overdose deaths in New Mexico.3 The chart presents:
- Excessive drinking (16% statewide): Measures the percentage of adults who report binge or heavy drinking.
- Alcohol-involved driving deaths (29% statewide): Represents the percentage of motor vehicle deaths where alcohol was a contributing factor, reflecting the impact of alcohol use on traffic safety.
- Adults who currently smoke (14% statewide): Indicates the percentage of adults who report current cigarette smoking.
- Drug Overdose Deaths (4.5 % statewide): Indicates the percentage of all deaths in a given year that were caused by drug poisoning. This measure provides context for the relative burden of overdose deaths within a county. Because overdose deaths are relatively rare—especially in smaller counties—percentages may be unstable or suppressed and should be interpreted with caution.
The visual is interactive—so you can use the dropdown menu at the top of the chart to choose a different county. When a new county is selected, the chart automatically updates to show that county’s results, allowing for easy, county-by-county snapshots. For example, when compared with statewide averages, Mora County reports similar or slightly lower rates across all these measures (13% report excessive drinking; 13% reported alcohol-involved driving deaths, 14% report currently smoking).
3. This data is only available from the 2024 New Mexico County Health Rankings.
Each data dashboard is organized into groups that display sectors side by side to support comparisons across related service sectors. These are the following grouped service sectors:
- Medical, Dental, and Behavioral Health Data Dashboard
- Food, Housing, and Job Training Data Dashboard
- Parent Supports and Early Childhood Learning Data Dashboard
- Community Schools and Youth Mentors Data Dashboard
Use the navigation below to navigate to the different dashboards. You can return to this page at any time.
Find out if your county is active in the 100% New Mexico Initiative.